
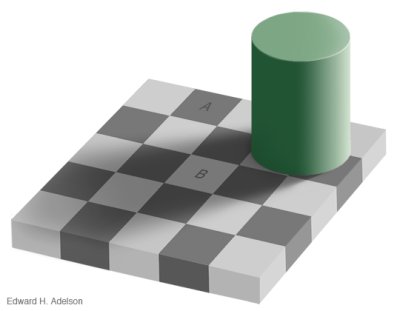
 If the output for working for the year is a square. And the job is to produce dark squares who do you pay more A or B? Of course it is a trick question, the squares are the same color. But it doesn’t look that way at first does it? Optical illusions provide evidence that you cannot always trust what seems obvious.
Dr. Deming’s red bead experiment provides some additional insight into the idea that our management systems often use “evidence” to support our believes when in fact the “evidence” does not mean what we think it does. Dr. Deming included the theory of knowledge (how do we know what we know) as one of the four areas of his management system. It is the areas of his work that is least appreciated and understood by managers today. Optical illusions provide a simple reminder of how easily we can think we know things that are not so.
It is important to question what you believe; even when it is as obvious as the A square being darker than the B square. Understanding the ease with which we can reach false conclusions can be a powerful aid in improving management decision making.
Never be satisfied that your current viewpoint is complete and accurate, instead create a climate of never ending continual improvement. By continually questioning and seeking improvement we can avoid traps our brains lay for us.
Related: The Illusion of Understanding – Change is not Improvement – Performance Appraisal Problems – Dr. Deming on Performance Appraisal: “The fact is that the system that people work in and the interaction with people may account for 90 or 95 percent of performance” (from the introduction to the Team Handbook) – It is a mistake to think improving the figures is the goal
Optical illusion by Edward H. Adelson


Pingback: Curious Cat Science and Engineering Blog
Pingback: Curious Cat Science and Engineering Blog » Mistakes in Experimental Design and Interpretation
Pingback: Curious Cat Science Blog » Poor Reporting and Unfounded Implications
Pingback: Curious Cat Science Blog » Magenta is a Color
Pingback: Curious Cat Science and Engineering Blog » Albert Einstein, Marylin Monroe Hybrid Image
Pingback: Curious Cat Science and Engineering Blog: Anscombe's Quartet
Pingback: Curious Cat Management Improvement Blog » Communicating with the Visual Display of Data
Pingback: Curious Cat Science and Engineering Blog » Science and Optical Illusions
Pingback: Your Brain Can Jump to Incorrect Conclusions » Curious Cat Management Improvement Blog
Pingback: Is the Result Due to Mathematical Probability or Individual Merit? « The W. Edwards Deming Institute Blog